
Manual


IQ3 Data Logger Dash Installation Manual
35
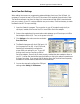
Display Pages
A view representing the current programming of all four display pages is obtained by selecting
the Display Pages tab. Each input is programmed by selected the text box related to that input
area, as indicated by the red line extending down to the dash, from each text box.
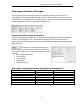
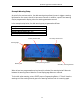
Bar Graph (Sweep Tach)
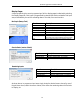
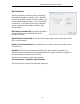
Gear Indicator (center of dash)
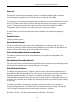
Remaining Inputs
As shown above, to program an input area, simply locate the desired sensor channel by use of
the pull down arrow, select the sensor channel, then define the remaining values for Decimals
to Display, etc.
Function Description
KPH MPH RPM Selection defines channel name on dash
Channel to Display Pull down arrow selects channel for bar graph data
Averaging Filter Smooths displayed data. 10 is default
Minimum Value Determines starting point for bar graph
Maximum Value Determine ending point for bar graph
Tag Start Value Determines start value for bar graph
Tag Value per 10 Bars Determines value for each 10 bar segment. There
are a total of 8, 10 bar segments for 80 total bars.
OK Closes window following programming changes
Function Description
Channel To Display Pull down arrow selects sensor channel
Averaging Filter Smooths displayed data. 10 is default
OK Closes window following programming changes
Function Description
Channel to Display Pull down arrow selects sensor channel
Decimals to Display Number of digits to display after decimal
Averaging Filter Smooths displayed data. 10 is default
Channel Tag Text Name displayed. 5 total characters