
Data Sheet

TELEFUNKEN Semiconductors
TLL.440.
Rev. A1: 01.06.19954 (7)
0
95 10051
20 40 60 80
100
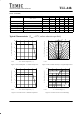
I – Relative Luminous Intensity
v rel
T
amb
– Ambient Temperature ( °C )
High Efficiency Red
I
F
=2mA
0
0.4
0.8
1.2
1.6
2.0
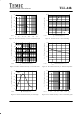
Figure 5. Rel. Luminous Intensity vs. Ambient Temperature
10 20 50 100 200
0
0.4
0.8
1.2
1.6
2.4
96 11490
500
0.5 0.2 0.1 0.05 0.021
I
F
(mA)
t
p
/T
I – Relative Luminous Intensity
v rel
2.0
High Efficiency Red
Figure 6. Rel. Lumin. Intensity vs. Forw. Current/Duty Cycle
0.1 1 10
0.01
0.1
1
10
100
100
95 10061
I – Relative Luminous Intensity
v rel
I
F
– Forward Current ( mA )
High Efficiency Red
Figure 7. Relative Luminous Intensity vs. Forward Current
590 610 630 650 670
0
0.2
0.4
0.6
0.8
1.2
690
95 10040
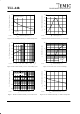
I – Relative Luminous Intensity
v rel
l
– Wavelength ( nm )
1.0
High Efficiency Red
Figure 8. Relative Luminous Intensity vs. Wavelength
01234
0.1
1
10
100
V
F
– Forward Voltage ( V )
5
95 10053
I – Forward Current ( mA )
F
Yellow
t
p
/T=0.001
t
p
=10
m
s
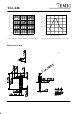
Figure 9. Forward Current vs. Forward Voltage
0
0.4
0.8
1.2
1.6
2.0
0
95 10054
20 40 60 80
100
I – Relative Luminous Intensity
v rel
T
amb
– Ambient Temperature ( °C )
Yellow
Figure 10. Rel. Luminous Intensity vs. Ambient Temperature