
Manual

GDM-8261(A) Remote Viewer Guide
22
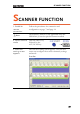
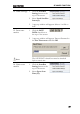
Plotting the data
1. First make sure you have saved a session and
loaded data to be able to plot data.
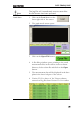
2. Press the Plot Graph button.
The data will be converted into a
graph form and will be displayed
in the screen. Currently the
graph will plot “Mode 1”
(display 1).
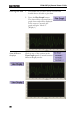
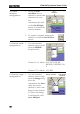
View different
displays
Click on any of the options in the
V
iew Graph panel to switch between
different display modes