
Software) Guide Instruction Manual

PLOT GRAPH/ SAVE
23
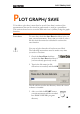
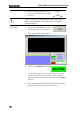
Plotting the data
1. First make sure you have saved a
session (page21 ) and loaded
data (page22 ) to be able to plot
data.
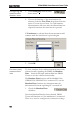
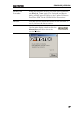
2. Press the Plot Graph button.
The data will be converted into a
graph form and will be displayed
in the screen. Currently the
graph will plot “Mod1” (display
1).
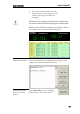
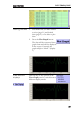
View different
displays
Click on any of the options in the
View Graph panel to switch between
different display modes