User's Manual
Table Of Contents

l
32
Working with Alarms
During operation, the Artemis system produces an audit trail of event messages. These
range in increasing order of severity from: Information, Warning, and Error to Fatal. As
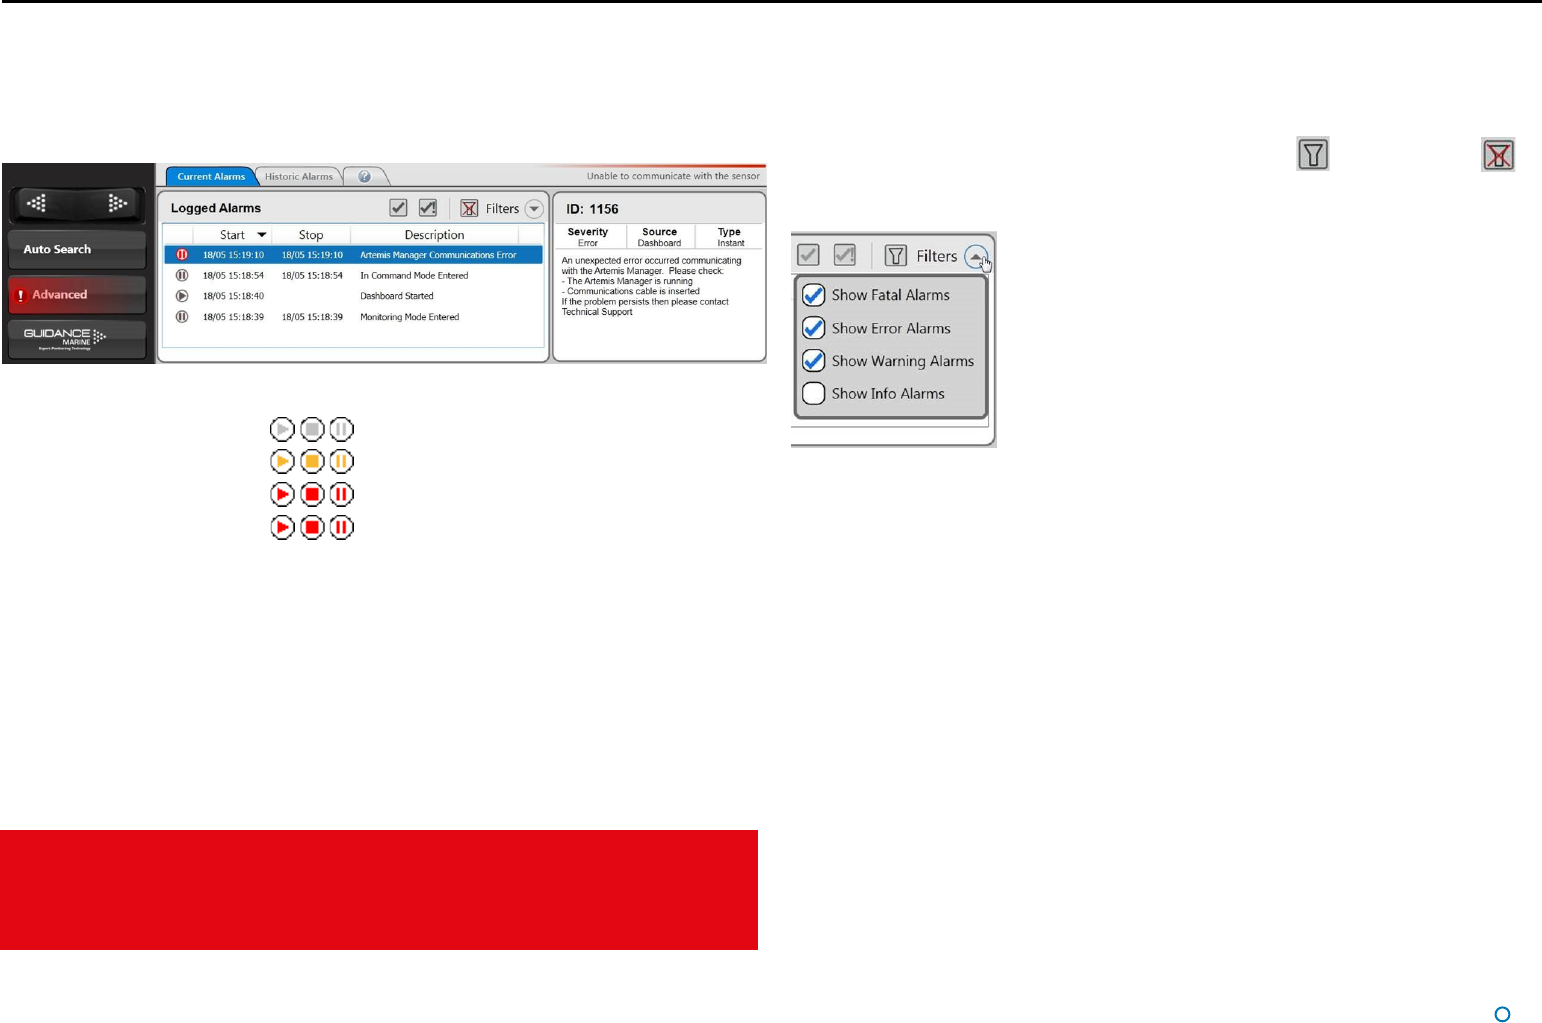
these alarms are raised, the Dashboard lists them within the Alarms pane. Click on any
alarm to display details about it in the right-hand section of the Alarm pane:
When a Fatal alarm occurs, communications with the sensor are disabled.
In order to return to normal operation, ensure that the fault condition has been
cleared, close the Dashboard and re-open. If communications are not re-established,
power the sensor off, wait for 20 seconds then power back on.
The severity and current state of an alarm are reflected in its colour and shape:
•
Information—grey symbols
•
Warning—orange symbols
•
Error—red symbols
•
Fatal—red symbols
The arrowhead symbol indicates that an alarm condition is persisting; an alarm in this state
will show a Start time but not a Stop time.
The square symbol means that the alarm condition no longer exists, therefore the alarm will
show both Start and Stop times.
The pause symbol indicates an instantaneous alarm. In this case, the Start and Stop times
are identical.
When an Error or Fatal alarm is raised, the Alarms pane is opened automatically and its
Side Bar button is shaded red as in the example above. If the pane is closed and re-
opened, the Side Bar button returns to its normal light grey shading.
Filtering Alarms
A filter is available to suppress the display of particular alarm types. By default, the filter is
activated and causes information messages to be hidden.
Click on the Alarm Filter button to toggle between activated
and de-activated .
Click on the Filter Selection button to choose which types of alarm are to be filtered out:
A tick means that alarms of the corresponding severity are always viewable in the alarms
list. No tick means that alarms of that severity are hidden when the filter is activated.


