
Product Overview
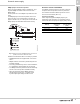
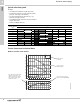
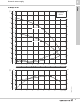
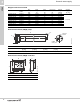

Table Of Contents
- 1. Grundfos DWS family
- 2. BMQE
- 3. MQ
- 4. JP Jet Pumps
- Product introduction
- Product overview
- Construction
- Operating conditions
- Selection
- Selection of pumps
- Installation
- Curve charts and technical data
- Dimensions and weights
- Cast iron shallow well, model JP05S-CI
- Cast iron shallow well, models JP15S-CI, JP20S-CI
- Cast iron shallow well, models JP30S-CI
- Shallow well stainless steel, model JP05S-SS
- Shallow well stainless steel, models JP07S-SS, JP10S-SS
- Cast iron deep well, models JP05D-CI, JP07D-CI
- Cast iron deep well, models JP15D-CI, JP20D-CI
- Electrical data
- Approvals
- 5. Further documentation

BMQE
Domestic water supply
2
12
Quick selection guide
Example:
• The maximum demand is 15 gpm (3.4 m
3
/h).
• The pressure required is 70 psi (4.8 bar) system
pressure at the taps in the building.
• The normal minimum inlet pressure (e.g. city
pressure) is 20 psi (1.4 bar)
• The additional boost required is 50 psi (3.5 bar) at
15 gpm (3.4 m
3
/h).
• Select a 15 BMQE 05A-110.
Curve charts and technical data
How to read the curve charts
Additional (boost)
pressure required
[psi]
Flow required [gpm]
5 10 15 2025303539
90
80
70
60
50
40
30
20
10
TM04 4551 1609
0 2 4 6 8 10 12 14 16 18 Q[USGPM]
0
50
100
150
200
250
300
[ft]
H
0
20
40
60
80
100
120
140
P
[psi]
0
20
40
60
80
100
H
[m]
0.0 0.5 1.0 1.5 2.0 2.5 3. 0 3.5 4. 0 4. 5 Q[m³/h]
07B -180 (5-s tage)
05A -110 (3-s tage)
0 2 4 6 8 10 12 14 16 18 Q[USGPM]
0.0
0.1
0.2
0.3
[hp]
P2
0
20
40
60
[%]
Eta
0.0
0.1
0.2
P2
[kW]
P2
Eta
15 BMQE
60 Hz
The efficiency curve shows the
efficiency of the pump. The
efficiency curve is an average
curve of all the pump types
shown in the chart.
Pump type and
frequency.
QH curve for the
individual pump.
The power curves indicate
pump input power per stage.
22 BMQE 10C-190
22 BMQE 05B-120
22 BMQE 05A-80 30 BMQE 05B-90
30 BMQE 10C-130
15 BMQE 07B-180
15 BMQE 05A-110