
Product Overview
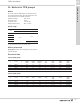
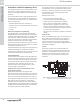
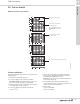
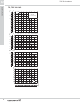
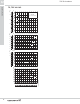
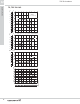
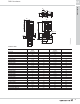
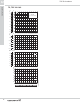
Table Of Contents
- Table of contents
- 1. Pump data
- 2. Performance range
- 3. Product range
- 4. Speed regulation
- 5. Operating condition
- 6. Pumped liquids
- 7. TP, TPE pumps
- 8. TPE Series 2000 pumps
- 9. TPE Series 1000 pumps
- 10. Communication
- 11. Motors
- 12. Curve charts
- 13. Installation
- 14. Accessories
- 15. Further documentation
- 16. Submittal data sheet

Curve charts
TPE E-circulators
12
23
12. Curve charts
How to read the curve charts
Curve conditions
The guidelines below apply to the curves shown on the
following pages:
1. Tolerances to ISO 9906, Annex A.
2. The curves apply to the performance of sin-
gle-phase pumps. For other versions, please see
the exact curves in WinCAPS or WebCAPS.
3. Measurements have been made with airless water
at a temperature of +68 °F (20 °C).
4. The curves apply to a kinematic viscosity of
1St(1mm
2
/s).
5. Due to the risk of pump overheating, the pumps
should not be used below the minimum flow rate
indicated by the bold-faced curves.
Note: We do not recommend constant operation at
a flow rate below 10 %.
6. If the pumped liquid density and/or viscosity is
higher than that of water, it may be necessary to use
a motor with a higher performance.
7. Motor speed:
2-pole = 3400 RPM
4-pole = 1690 RPM
TM02 5553 2102
0 10 20 30 40 50 Q [US GPM]
0
5
10
15
20
25
30
35
40
45
[ft]
H
0
2
4
6
8
10
12
14
[m]
H
TP 32
60 Hz
ISO 9906 Annex A
-160/2
-80/2
0 10 20 30 40 50 Q [US GPM]
0.0
0.1
0.2
0.3
0.4
0.5
0.6
0.7
[hp]
P2
0.0
0.1
0.2
0.3
0.4
0.5
[kW]
P2
-160/2
-80/2
0 10 20 30 40 50 Q [US GPM]
0
5
10
15
20
25
30
35
[ft]
NPSH
0
2
4
6
8
10
[m]
NPSH
-160/2
-80/2
0 10 20 30 40 50 Q [US GPM]
40
45
50
55
60
65
70
Eff
[%]
0 2 4 6 8 10 12 14 Q [m³/h]
-160/2
-80/2
Pump type and frequency.
QH curve for the individual
single-head pump.
The bold curve indicates the
recommended performance
range.
The power indicates pump
input power (P
2
)
The eta curve shows the pump efficiency