
Product Overview
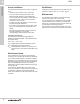
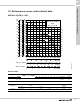
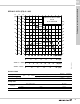
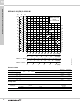
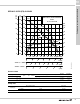
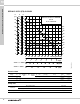
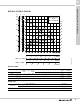
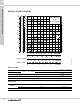
Table Of Contents
- 1. Introduction
- 2. Identification
- 3. Selection of product
- 4. Performance range
- 5. Product range
- 6. Variants
- 7. Construction
- 8. Product description
- 9. Curve charts
- 10. Performance curves and technical data
- SEG.A15.20.(EX).2.1.603
- SEG.A15.20.R2.(EX).2.1.603
- SEG.A15.20.R1.(EX).2.1.603
- SEG.A15.20.(EX).2.60H/L/M
- SEG.A15.20.R2.(EX).2.60H/M
- SEG.A15.20.R1.(EX).2.60H/M
- SEG.A15.30.(EX).2.60H/L/M
- SEG.A15.40.(EX).2.60H/L/M
- SEG.A15.55.(EX).2.60H/L/M
- SEG.A20.30.(EX).2.60H/L/M
- SEG.A20.40.(EX).2.60H/L/M
- SEG.A20.55.(EX).2.60H/L/M
- 11. Dimensions and weights
- 12. Accessories
- 13. Grundfos Product Center

Curve charts
SEG
9
21
9. Curve charts
How to read the performance curves
The curves on the following pages apply to SEG pumps.
Note: The pumps are tested according to ANSI HI 11.6:2012 3B tolerance. Testing equipment and measuring
instruments are designed and calibrated according to the standards mentioned. The pumps are approved according to
tolerances for entire curves, specified in grade 3B.
SEG Page
SEG.A15.20.2.1.603 23
SEG.A15.20.R2.2.1.603 24
SEG.A15.20.R1.2.1.603 25
SEG.A15.20.2.60H/L/M 26
SEG.A15.20.R2.2.60H/L/M 27
SEG.A15.20.R1.2.60H/L/M 28
SEG.A15.30.2.60H/L/M 29
SEG.A15.40.2.60H/L/M 30
SEG.A15.55.2.60H/L/M 31
SEG.A20.30.2.60H/L/M 32
SEG.A20.40.2.60H/L/M 33
SEG.A20.55.2.60H/L/M 34
TM05 8126 4715
4>86*30@
>IW@
+
Y>IWV@
>@
(II
4>OV@
Y>IWV@
>P@
+
6(*$
+]
+,%
(II
4+
(II
3
3
4>86*30@
>KS@
3
$16,ò'1
$16,'1
Total pump head
H = H
total
QH curve
Pump type
Power curves
indicating input power
(P
1
) and output power
(P
2
) of the pump
shown.
Eff2 is the hydraulic
efficiency (pumps)
Eff1 is total efficiency
(pump + motor)
ANSI 1 1/2 / DN40