
MAGNA1 Pumps Product Guide
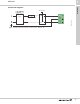
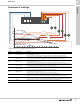
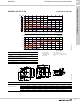
Table Of Contents

Guide to performance curves
MAGNA1
9
16
9. Guide to performance curves
Each pump setting has its own performance curve
(Q/H curve). A power curve (P1 curve) belongs to each
Q/H curve. The power curve shows the pump power
consumption (P1) in Watt at a given Q/H curve.
The P1 value corresponds to the value that can be
read from the pump display. See fig. 14.
Fig. 14 Performance curves in relation to pump setting
TM05 2778 4112
Q
Q
P1
III
II
I
III
II
I
H
PP3
CP3
CP2
PP1
CP1
PP2
Setting Pump curve
PP1 Lowest proportional pressure curve
PP2 Intermediate proportional pressure curve
PP3 Highest proportional pressure curve
CP1 Lowest constant pressure curve
CP2 Intermediate constant pressure curve
CP3 Highest constant pressure curve
III Constant curve duty, fixed speed III
II Constant curve duty, fixed speed II
I Constant curve duty, fixed speed I