
User manual


FIRMWARE VERSION 1.0.1.38 GXV3175V2 USER MANUAL Page 114 of 138
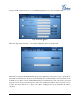
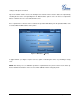
Figure 115: Maintenance Factory Functions
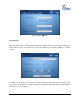
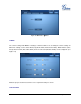
The Debug page (as shown in the Figure 116) contains the built-in debug tools for GXV3175. The debug
tools make it more convenient to obtain corresponding information and traces when the system encounters
problems. To start capturing traces, users need to Enable Application Debug and press the “Start” button
next to the Capture Packets option. The captured traces are available for downloading through the web
configuration interface and can be sent to Grandstream Support for troubleshooting. The captured trace
files can also be deleted by pressing the “delete” button.
To perform a network connection test, users could enter the IP address in “Network Test (Ping)” to ping the
destination. The testing result will show in the table below in Figure 116. Press “Stop” to stop the operation.
Figure 116: Maintenance Debug
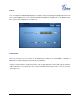
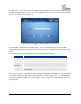
In page “Backup” (See Figure 117), Backup/Restore functionality is provided to the users, making it easy to
backup any current configuration settings on a regular interval (daily/weekly/monthly) and restore these