
User's Manual


LTL-400Thrif-T Luber Low-Pressure Orifi ce Lubrication System
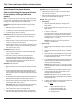
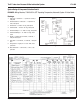
Design Chart A
For Selection of Automatic Pumps
DESIGN CHART D
Page 14
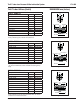
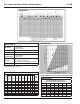
DESIGN CHART C
Ori-
fi ce
Size
A B C D E F G H I
Flow
Value
Max:
Min
512-
:1
256:1 128:1 64:1 32:1 16:1 8:1 4:1 2:1
5/0 1 — — — — — — — — 0.018
4/0 2 1 — — — — — — — 0.037
3/0 4 2 1 — — — — — — 0.074
2/0 8 4 2 1 — — — — — 0.153
0 16 8 4 2 1 — — — — 0.305
1 32 16 8 4 2 1 — — — 0.612
2 64 32 16 8 4 2 1 — — 1.219
3 128 64 32 16 8 4 2 1 2.443
4 256 128 64 32 16 8 4 2 1 4.876
5 512 256 128 64 32 16 8 4 2 9.752
Orifi ce Selection Columns A-1 are Max: Min Base Ratios
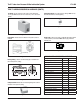
DESIGN CHART E
Approximate SUS Oil Viscosities for SAE
Number System at Various Temperatures (
O
F)
50
O
60
O
70
O
80
O
100
O
210
O
SAE 70 17,000 10,000 6,500 4,000 1,850 130
SAE 60 11,500 7,000 4,500 3,000 1,400 110
SAE 50 8,500 4,600 3,000 2,000 985 90
SAE 40 4,700 3,000 1,900 1,350 680 75
SAE 30 3,100 2,000 1,350 950 490 65
SAE 20 2,000 1,300 900 650 350 57
SAE 10 850 600 420 310 185 46
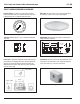
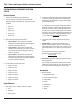
DESIGN CHART B
Plain Bearing
Area = π x D x L
D = shaft diameter
L = length of bearing
Slide, Gibs & Ways A = width x length + travel
Anti-Friction Area = shaft diameter
2
x number of rows
Gears (calculated
each gear in train)
Area = π x Pd x W
Pd = pitch diameter
W = width of gear
Ball Screw
Area = π x Pd x rows x travel
Pd = pitch diameter of ball race
Rows = number of rows in engagement with shaft
Note π = 3.14
Suggested Lube Replenishment Guidelines. The replenishment lube value
in cubic inches per hour = Area x .001