
User's Manual


PerformanceCharts
Performance Performance
Performance
Charts Charts
Charts
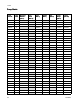
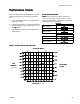
Tondtheuidpressure(psi/bar/MPa)ataspecic
uidow(gpm/lpm)andpercentageofmaximum
force:
1.Locatethedesireduidowinthescaleatthe
bottomofthechart.
2.Followtheverticallineuptotheintersectionwith
theselectedpercentageofmaximumforce(see
theKey Key
Key
below).
3.Followlefttotheverticalscaletoreadtheuid
outletpressure.
Key Key
Key
to to
to
Performance Performance
Performance
Charts Charts
Charts
NOTE: NOTE:
NOTE:
Thechartsshowthemotoroperatingat
100%,70%,and40%ofmaximumforce.These
valuesareapproximatelyequivalenttoanairmotor
operatingat100,70,and40psi.
Pressure Pressure
Pressure
MaxPressure
A
70%Pressure
B
40%Pressure
C
Motor Motor
Motor
Amps/Watts Amps/Watts
Amps/Watts
MaxPressure
A
70%Pressure
B
40%Pressure
C
Table Table
Table
2 2
2
. .
.
E E
E
- -
-
Flo Flo
Flo
DC DC
DC
with with
with
Dura Dura
Dura
- -
-
Flo Flo
Flo
145 145
145
Lower Lower
Lower
CYCLES CYCLES
CYCLES
PER PER
PER
MINUTE MINUTE
MINUTE
0
400
(2.8, 28)
800
(5.5, 55)
1200
(8.3, 83)
1600
(10.0, 1 10)
2000
(13.8, 138)
2400
(16.6, 166)
2800
(19.3, 193)
3200
(22.1, 221)
3600
(24.8, 248)
0.0
1.0
2.0
3.0
4.0
5.0
(0)
(200)
(400)
(600)
(800)
(1000)
6.0
(1200)
7.0
(1400)
8.0
9.0
0.0 0.1
(0.38)
0.2
(0.76)
0.3
(1.14)
0.4
(1.52)
0.5
(1.90)
0.6
(2.28)
0.7
(2.66)
0.8
(3.04)
3 8 14 21
0.9
(3.42)
1.0
(3.80)
A
B
C
A
B
C
MOTOR MOTOR
MOTOR
AMPS AMPS
AMPS
(WATTS) (WATTS)
(WATTS)
FLUID FLUID
FLUID
PRESSURE: PRESSURE:
PRESSURE:
psi(bar,MPa)
FLUID FLUID
FLUID
FLOW: FLOW:
FLOW:
gpm(lpm)
333389A 29