
Operation Manual
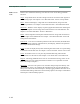
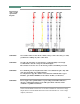
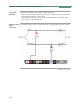
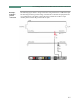
Table Of Contents
- Title Page - Energy Platform User Guide
- Table of Contents
- Chap 1 Getting Started
- Chap 2 Voltage Measurement Cable and Current Probe Connections
- Chap 3 View Real Time Data
- Chap 4 Instrument Settings
- Chap 5 Start Menu
- Chap 6 Advanced Setup Options
- Chap 7 View Event Data
- Chap 8 Reports
- Chap 9 Downloading Events
- Appendix A Optional Accessories
- Appendix B Technical Specifications
- Appendix C Battery Specifications and Replacement Procedure
- Appendix D User Replaceable Parts List
- Appendix E Common Circuit Connections
- Appendix F Event Classification
- Appendix G Energy Platform Menu Structure
1-16
Basic Operation, continued
Home screen
icons
Home screen contains the following icons used to access various Energy Platform
functions:
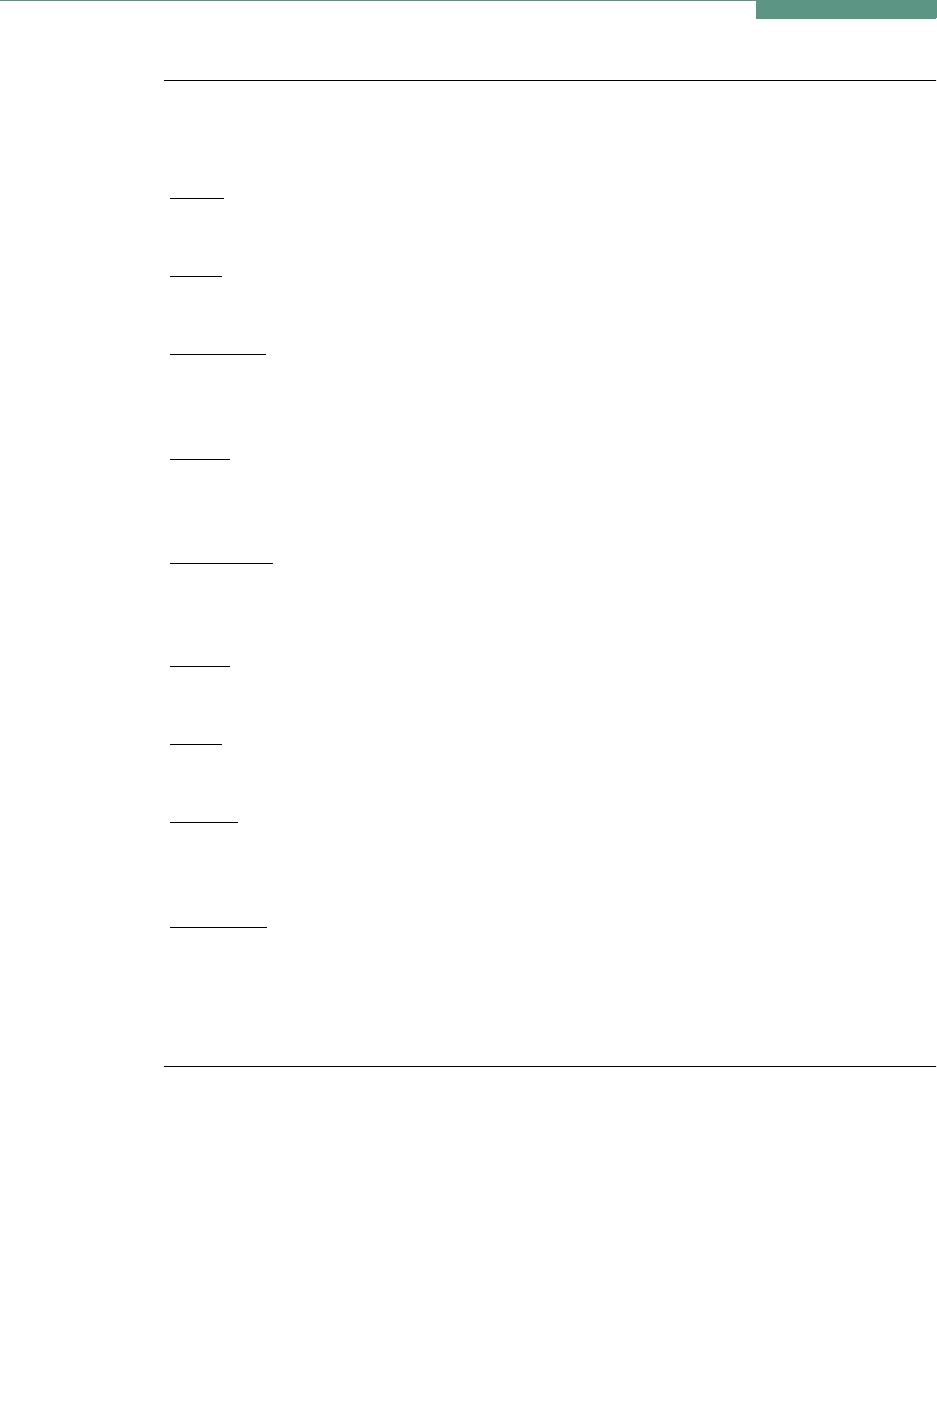
Scope
- Scope mode shows real-time voltage and current waveforms of the signals on
the measuring inputs. See Chapter 3 View Real Time Data - Section A Scope Mode.
Meter
- Meter mode displays voltage and current measurements, along with other
calculated parameters. See Chapter 3 View Real Time Data - Section B Meter Mode.
Harmonics
- Harmonic screen displays a spectral graph and textual matrix featuring the
amplitude and phase of each voltage and current harmonic to the 63rd harmonic. See
Chapter 3 View Real Time Data - Section C Harmonics.
Phasor
- Phasor diagrams indicate phase relations between voltage and current based
upon the angles of the fundamental. See Chapter 3 View Real Time Data - Section D
Voltage and Current Phasor.
Preferences
- Users can set instrument preferences like time and date, threshold alarm
feedback, language selection, communications, LCD display, and data card operation.
See Chapter 4 Instrument Settings.
Events
- Events are displayed only after monitoring has been turned on or upon reading
a stored file from the data card. See Chapter 7 View Event Data - Section A Event List.
Trend
- Trend allows users to view plots of journalled data along with min/max
measurements over the interval. See Chapter 7 View Event Data - Section B Trend.
Reports
- The Energy Platform allows users to view Demand or Energy status via the
report panels. The color coded panel indicates whether or not a parameter is within
limits. See Chapter 8 Reports.
Start/Setup
- Users have the option to use Automatic Setup and proceed directly with
data monitoring or they can configure the instrument step-by-step using the Wizard
Setup. Users can also do advanced setups to modify trigger parameters and intervals or
tweak threshold settings under the Advanced Setup Options. See Chapter 5 Start Menu
and Chapter 6 Advanced Setup Options.