
Operation Manual

Live Sensor Graphs
Toolbar Icon:
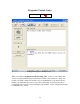
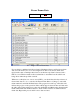
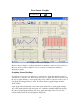
Image 10: Live Sensor Graphs
The Live Sensor Graphs tool (Image 10) functions similarly to the Live Sensor Grid tool.
However, the Live Sensor Graphs tool does not allow recording and is limited to
displaying 4 graphs.
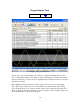
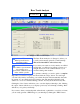
Graphing Sensor Readings
To graph up to four sensors in real-time, you will need to check the checkbox beside of
each sensor you intend to use. Then select each sensor to graph, the units of measure, and
the type of graph. Finally, you can specify the period of time to represent on the x-axis of
each graph by setting the history value. To activate the live graphs, simply click the
“Start” button.
A line graph will automatically connect data points with a line (top left graph in Image
10). A bar graph will draw each data point as a vertical bar with the height representing
the value (top right graph in Image 10). A dot graph will simply draw a dot for each
collected data point (both bottom graphs in Image 10).
19