
manual

GFI Network Server Monitor Monitoring checks status • 102
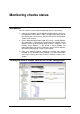
Viewing the state of checks from the GFI N.S.M. Activity Monitor
GFI Network Server Monitor ships with an Activity Monitor which
enables you to view the status of the monitoring engine and
monitoring checks. This activity monitor is automatically installed with
GFI Network Server Monitor and thus it can only be used from the
computer where this software is installed. To launch the Activity
Monitor, go on Start > Programs > GFI Network Server Monitor 7 >
GFI N.S.M. 7 Activity Monitor.
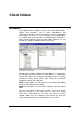
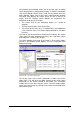
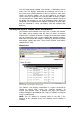
Screenshot 97 - Engine Status tab
The GFI N.S.M. Activity Monitor opens up by default in the ‘Engine
Status’ tab. This tab displays all the information related to the activity
of the monitoring engine. Such information includes:
• The date and time of the activity.
• The type of activity (e.g., Error, Warning, etc.).
• A description of the event.
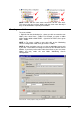
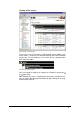
Icons on the left-hand-side of each event graphically indicate the
event type. These icons help you to easily identify the status without
having to read the ‘Type’ column details.
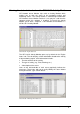
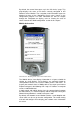
Screenshot 98 - Monitoring Check Status tab