
Use and Care Guide


45
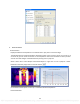
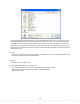
6. ANALYSIS CHART
6.1. Distribution
Display distribution of temperatures of a selected line or ploy-line on a thermal image.
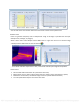
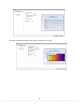
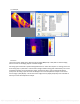
The following picture shows temperature distribution charts of line L1 with a vernier. If a vernier is on
a line like L1, you can move the vernier to see temperature value and coordinate of vernier position.
You also can view changes of the distribution by moving a line or poly-line.
Action: select menu Tools=>Analysis Chart=>Distribution or right click on line or polyline =>select
Distribution from the popup menu or click the shortcut .
X coordinate indicates pixels on the line; Y coordinate indicates temperature.
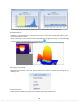
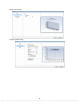
Partial distribution:
PDF compression, OCR, web optimization using a watermarked evaluation copy of CVISION PDFCompressor