Instruction Manual

48
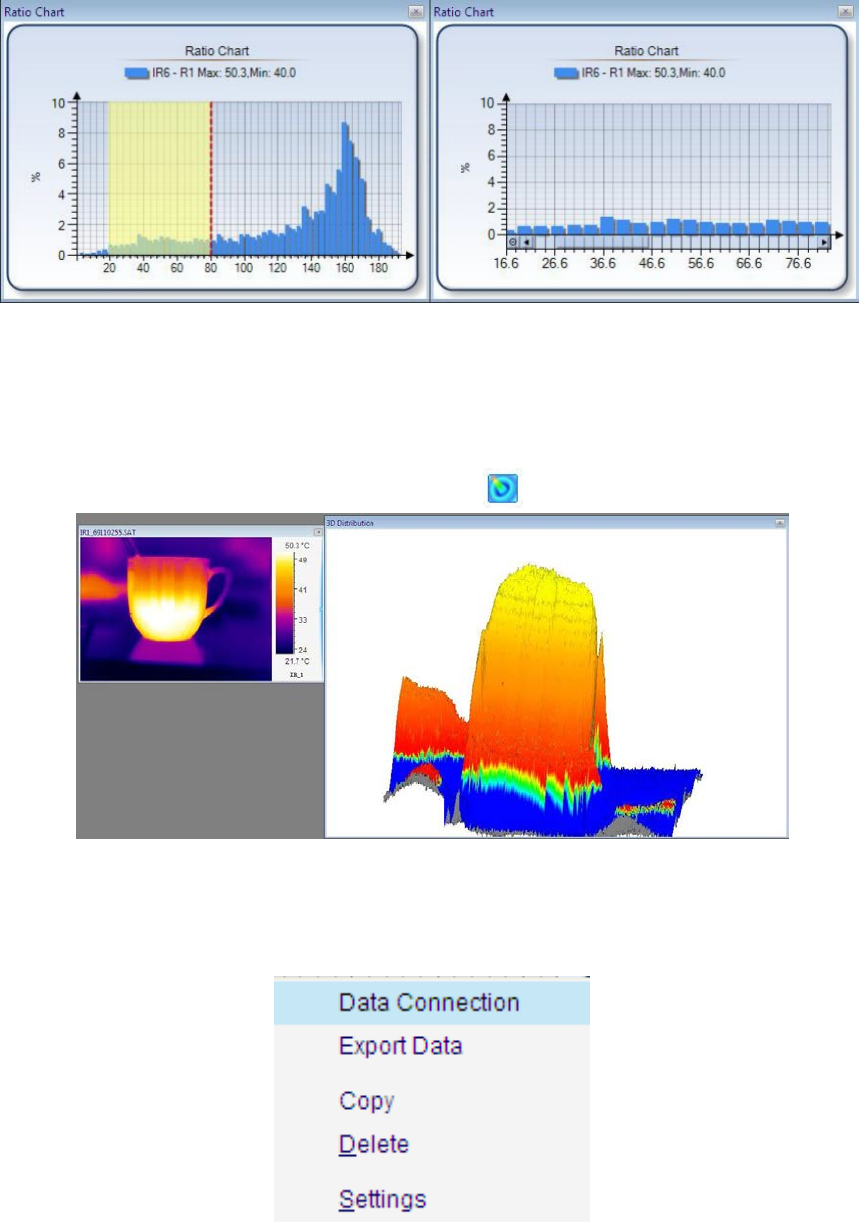
You can click minus circle at lower left corner of the chart to zoom out the partial ratio.
6.4. 3D Distribution
Show the current distribution in a three dimension view. X and Y axis indicate pixel position, Z axis
indicates temperature value.
Action: select menu Tools=>Analysis Chart=>3D Distribution or right click mouse on a thermal image
=>Analysis Chart=> 3D Distribution or click the shortcut .
6.5. Analysis chart settings
Right click on distribution, ratio chart, trend or partial trend, there are analysis chart settings as the
following one:
(1) Data Connection
Data connection allows you to generate an analysis chart with multiple tools.


