
User's Manual


P380 Users guide
31
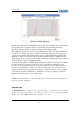
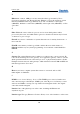
Figure 26: Monitoring page
The Monitoring menu shows TX/RX statistics graph. These statistics show a five-minute
average traffic rate over the last 24 hours period. RX (green) indicates incoming
(Received) traffic and TX (red) indicates outgoing (Transmitted) traffic.
The TX/RX monitoring is restarted on every P380 reboot. The reason is that P380 has no
real time clock, and the time used is relative to P380 restart. The first statistics appear as
2 points after 5 minutes after P380. Normal view is acquired 10 minutes and later after
P380 reboot. Click on the 'Show' button is needed when first time the TX/RX statistics
applet appears in browser window. Next time click 'Refresh' button which appears instead
of 'Show' button to get newer TX/RX statistics.
You can also manipulate on TX/RX graph time interval. There are two drop-down menus
used for this purpose. The first one is used to choose the interval starting hour. It is
possible to choose any hour from the last 24 hours, but choice can be limited to fewer
hours because of P380 reboot. The second drop-down is used to choose time interval
duration in hours. The possible choices are from 1 to 25 hours, but it also can be limited
to fewer hours because of P380 reboot. Sometimes you can get 24 instead of 25 hours
limit because relative time is even to hour range.
~Note: On older firmware versions, only 'Refresh' or 'Show' buttons are available, but
they have the same behaviour.
Upgrade page
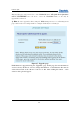
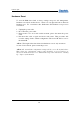
~ Important! When clicking on the “Upgrade button” in the main menu, a warning
message box will pop up. Do not enter this page if there is no need to upgrade P380.
Simply click on the “Reset” button, if no upgrade is necessary.