
Technical Specifications


593
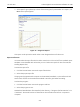
Diagnostics Tab
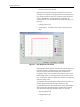
Figure 15 Choose Signature Curve
Clicking the Export button creates a comma separated value file
(.csv) of the diagnostic data being shown on the graph. CSV files
can be read directly into Excel where you can create graphs or per-
form other analysis.
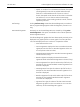
Show Data Points
Selecting this option will show a+ at each data point on the graph.
Show Diagnostic Info
Clicking this button opens a window that shows the friction and
spring range of each standard actuator signature on the diagnos-
tic graph. No information is shown for diagnostic graphs that are
not standard actuator signatures.
Results The results of the Response Time test are displayed in the results
box.
Change Mode The SVI can be in any of several operating modes:
Operating: In this mode the SVI responds to the input signal
and positions the valve appropriately (indicator green).
Manual: In this mode the valve does not respond to the
input signal. Instead it remains stable in one position which
is the position that the valve was when manual mode was
entered or a new position selected by the user (see Setpoint)
(indicator yellow).
Configure: In this mode you can set configuration
parameters of the positioner or controller (indicator yellow).
Calibrate: In this mode you can set calibration parameters
of the positioner (indicator yellow).