
Technical Specifications


591
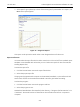
Diagnostics Tab
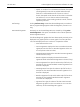
Number of points to sample
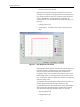
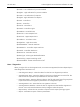
Step Profile: Measures the position response over time of
the valve to a request to change position. o Starting position
(%). This test produces a time vs. position graph where the
valve is requested to change position. The graph can
contain data for 2 to 10 seconds of data with data every 0.1
seconds.
Ending position (%)
Sample time – Number of seconds to sample at each
step
Figure 14 Step Response Test Results
Extended Actuator Signature: The same test as the standard
actuator signature except that you can specify a position
range for the test and that sample data is taken more
frequently. (every 0.1 seconds). This provides a much more
detailed signature. The ending position may be less than 0
(e.g. –5.0%) which allows a signature to examine the seating
response of the valve.
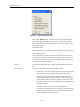
An Extended Actuator Signature test produces a pressure vs.
position graph where the actuator pressure is first
increased slowly then decreased slowly. The graph displays
data for the user selected position range both increasing
and decreasing with data sampled every 0.1 seconds.
Starting position (%)
Ending position (%)