
Technical Specifications

ValVue Digital Communications Software Ver. 2.80
570
GE Oil & Gas
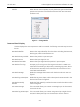
Capture to
Clipboard
Clicking
this
button saves an image
of
the graph on the clipboard. The
image
(a bitmap) can
be
pasted into another document
(e.g.
into
a
Micro-
soft Word document
)
.
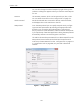
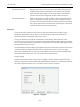
Zooming
Any portion of a diagnostic graph can be examined more closely by entering the new X and Y
scales in the proper scale edit boxes or by dragging the mouse across an area of the graph.
lithe mouse is dragged across an area, that area fills the graphic window Right button clicking
on the graph restores the default scales.
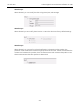
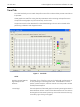
Menu-
Trend
When you right-click on the Trend tab (but not in the graph area -see zooming), a context
menu appears:
Refresh Graph- Restarts the sampling of the Trend graph.
Stop Graph- Stops the sampling of the Trend graph. It can be restarted by selecting
Refresh Graph.
Report Setup -Allows you to select a report file and a report printing program.
Report- Generates a report of the SVI parameters.
Detach Trend- Removes the Trend display from the tabbed dialog and creates a
separate display.
Help- Displays the help file at the Trend tab instructions.