
Technical Specifications

ValVue Digital Communications Software Ver. 2.80
568
GE Oil & Gas
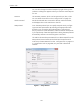
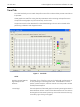
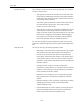
Trend Tab
From the Trend tab you can watch the performance of the valve and the process controller as
it operates.
These graphs are useful for tuning the PID parameters and monitoring valve performance.
The process trend graphs may be zoomed only on the Y axis.
The process trend can be detached from the tabbed dialog so that it can be viewed while
performing calibration and diagnostic tasks.
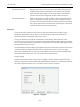
Figure 5 Trend Tab
Fields
Position, Manual Setpoint,
Signal Setpoint and
Pressure
The display
of
any of the four curves on the
Trend
graph
can be
turned
on
or
off by checking
or
unchecking these boxes. The
available
curves
are
position, position setpoint, and
if
the controller
is
on the process variable
and
the
process
setpoint.
Y
Low/High
The
Y axis
(position)
of
the trend graph can
be
set by entering the values in
these
edit
boxes. Enter
a
number and hit
tab to
set
the
scale. The
axis
can
be
changed with the mouse
by
zooming and can
be
returned
to
the origi-
nal
scale
by right-clicking
in
the
graph.