
Technical Specifications


ValVue Digital Communications Software Ver. 2.80
140
GE Oil & Gas
Export to Excel
Select Export to Excel and Excel opens with the Diagnostic Graph data exported into an Excel
spreadsheet. You must then save the data as an Excel file.
NOTE If there is no curve displayed in the graph ValVue displays an error
message No curves to export.
Capture to Clipboard
Select Capture to Clipboard and ValVue captures the diagnostic graph to the Windows
clipboard. Open any Windows program that can process images, such as Microsoft Word or
WordPad, and paste the image of the diagnostic graph.
Print Report
Select Print Report and ValVue captures a report and opens it in your Report Setup selection,
which you can then print or save.
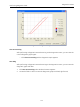
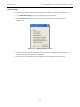
Select Curves
You can view two positioner signatures in addition to the current signature. The two other
signatures, represented by blue and black curves, can be displayed in the Diagnostic Graph.
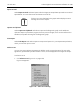
To select a curve:
1. Click Select Curve (Figure 117 on page 139).
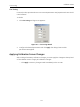
Figure 118 appears.
Figure 118 Select Curve Dialog