
Technical Specifications


ValVueFF Software Interface to FVP
156
GE Energy
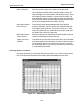
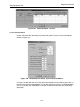
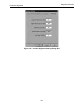
Therefore, the application displays a dialog box at the center of the graph area after a
multi step response test is performed (Figure 132). This dialog box displays only once.
Figure 132 Step Response Notice
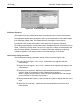
Step Response Patterns
This section gives examples of a step response setup for normal, Cyclical, Cyclical with
Deadband and Resolution.
Normal
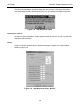
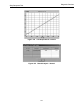
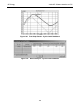
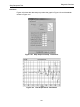
Figure 132 shows the data setup to produce the graph in Figure 134 and the tabular
results in Figure 135.
Figure 133 Step Response Setup - Normal