
Technical Specifications

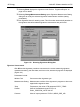


ValVueFF Software Interface to FVP
144
GE Energy
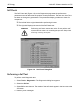
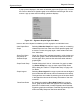
Show Set Points For Step Response Test only. Checking/Unchecking Show Set
Point from a pop-up menu displays or hides the set points curve
in step response graph. The default mode shows the set points
curve.
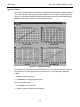
Zoom In/Zoom Out Zoom In: In the curve area of a graph window, a selected rectan-
gle area by mouse zooms in. Zoom Out: double-clicking or select
Zoom Out from pop-up menu restores current displaying scale
setting to default.
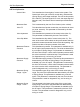
Signature Summary Selecting a curve and selecting Measurement Summary from
the pop-up menu opens Signature Summary, Dialog box to show
signature measurement information. Refer to “Signature Sum-
mary” on page 146 for details.
Signature Notes Selecting a curve and selecting Signature Notes from the
pop-up menu displays User Notes. This information is editable.
Refer to “Signature Notes” on page 147 for details.
Remove Curve Selecting a curve and selecting Remove Curve from pop-up
menu deletes the curve from the graph.
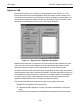
Load Signature Graphs
To load a group of graphs:
1. Select File > Load.
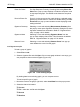
2. Select a signature file and click Open. If the current graph window is not empty, you
are prompted to clear out the old graph (Figure 123).
Figure 123 Clear Existing Graphs
By loading data into an existing graph, you can compare curves.
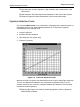
To load a specific type of graph:
1. Move the cursor to the graph, right-click, select Load Data from the pop-up menu.
2. Select the data to be loaded:
❑ Current
❑ File - select the .std file and click Open.
❑ Record
❑ Baseline