
Technical Specifications


© 2014 General Electric Company. All rights reserved.
282 | =GE Oil & Gas
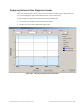
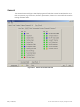
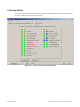
The diagnostic graph for the selected data point appears (Figure 305).
Figure 305 Historical View Diagnostic Graph
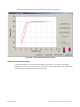
Diagnostic Graph Color Legend
Located at the bottom of each SVI II ESD diagnostic graph is a color legend. The legend
identifies by color each curve and step on the graph, currently displayed, and any additionally
selected (using the Select Additional Curve function).