
Technical Specifications


© 2014 General Electric Company. All rights reserved.
276 | =GE Oil & Gas
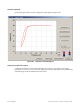
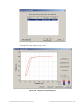
Diagnostic Graph Color Legend
Located at the bottom of each SVI II ESD diagnostic graph is a color legend. The legend
identifies by color each curve and step on the graph; currently displayed and any additionally
selected (using the Select Additional Curve function).
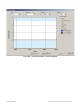
Historical View
The historical view provides a graphic representation of all historical data collected on the
selected ESD.
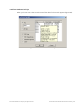
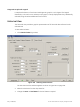
To start Historical View:
1. Click Historical View (Figure 300).
Figure 300 Selecting Historical View
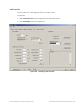
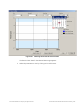
The PST Historical View window appears as shown in Figure 301 on page 278.
2. Select the Device ID from the drop down list.
3. Change the Start and End Dates for the PST data as required.