Masoneilan Valves ValVue ESD Instruction Manual =| 263
© 2014 General Electric Company. All rights reserved.
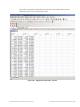
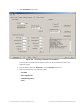
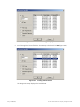
Microsoft Excel appears and displays the X axis and Y axis values, taken from the
diagnostic graph, as Excel values (Figure 283).
Figure 283 Diagnostic Graph Data - in Excel