
Technical Specifications

© 2014 General Electric Company. All rights reserved.
258 | =GE Oil & Gas
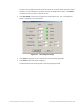
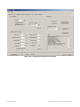
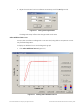
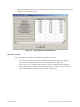
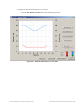
The Partial Stroke Test Result in the window appears (Figure 277). All diagnostic results are
displayed in a numerical format.
Figure 277 PST Diagnostics Computed Result
Pos. & Pres. vs Time
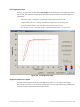
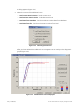
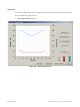
You can view the PST results on the Diagnostic Graph in two views:
Pos. vs Pres. - Position vs Pressure, the default view when the diagnostic graph is
launched and is represented by the red curve (Figure 269 on page 253).
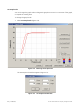
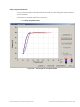
Pos. & Pres. vs Time - Position and Pressure vs. Time, an additional view displayed
above the Position vs Pressure view, that displays the ramp down and up of the PST,
and is represented by the blue curve as shown in Figure 278.