
Technical Specifications

© 2014 General Electric Company. All rights reserved.
256 | =GE Oil & Gas
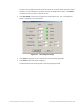
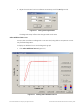
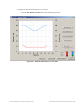
A dialog appears (Figure 274).
2. Select the source of the additional curve:
Load Current Data in Device - loads current curve
Load Previous Data in Device - loads last saved curve
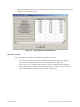
Load Data from Database - launches window to select data from database
Load Data from File - launches to browser to select file to load
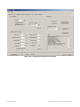
Figure 274 Selecting Data Source
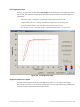
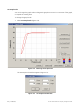
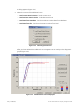
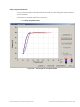
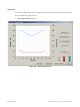
After you have selected the additional curve it appears as an overlay on the diagnostic
graph (Figure 275).
Figure 275 Additional PST Curve Displayed