
Technical Specifications

Masoneilan Valves ValVue ESD Instruction Manual =| 255
© 2014 General Electric Company. All rights reserved.
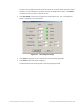
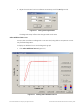
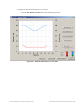
2. Adjust the X axis and Y axis coordinates as necessary and click OK (Figure 272).
Figure 272 Saving Scale Adjustments
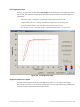
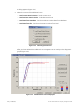
The Diagnostic Graph reflects the changes made to the axes.
Select Additional PST Curve
You can view more than one diagnostic curve at a time; being able to compare two curves
may facilitate diagnostics.
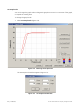
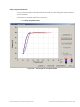
To display an additional curve on the diagnostic graph:
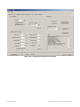
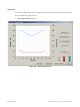
1. Click Select Additional Curve (Figure 273).
Figure 273 Starting Select Additional Curve