
Technical Specifications

Masoneilan Valves ValVue ESD Instruction Manual =| 253
© 2014 General Electric Company. All rights reserved.
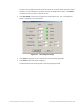
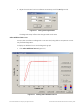
PST Diagnostic Graph
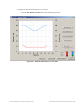
After you complete the PST and select View Graph the results appear on the Diagnostic Graph
(Figure 269). The Diagnostic Graph has several features that provide even further diagnostic
capabilities:
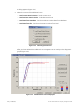
Set Graph Scale - change the coordinates of the Pressure, Position axes.
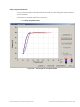
Select Additional Curve - display an additional, selected, curve on the graph
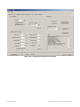
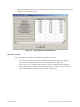
Show Computed Result - view the data in a numerical value format
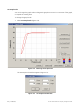
Pos. & Pres. vs Time - view PST result in a position and pressure vs. time format
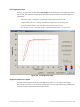
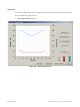
Figure 269 PST Diagnostic Graph
Diagnostic Graph Color Legend
Located at the bottom of each SVI II ESD diagnostic graph is a color legend. The legend
identifies by color each curve and step on the graph, currently displayed, and any additionally
selected (using the Select Additional Curve function).