
Technical Specifications


© 2014 General Electric Company. All rights reserved.
226 | =GE Oil & Gas
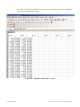
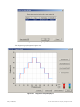
Diagnostic Graph Color Legend
Located at the bottom of each SVI II ESD diagnostic graph is a color legend. The legend
identifies by color each curve and step on the graph; currently displayed and any additionally
selected (using the Select Additional Curve function).
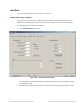
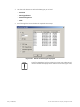
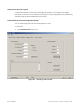
Load Data from a File on Diagnostics Screen
You can load a diagnostic file from the Diagnostics screen.
To load a file:
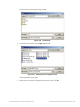
1. Click Load From File (Figure 237).
Figure 237 Selecting Load From File