Technical Specifications
Manuals
Brands
GE Manuals
Oilfield
GE Valve Software Tools MN-ValVue_ESD_IOM
221
222
223
224
225
226
227
228
229
230
© 2014 General Electric Comp
any. All rights reserved.
222
|
=
GE Oil & Gas
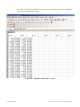
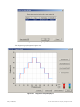
Microsoft Excel op
ens and display the X axis
and Y axis values, tak
e
n from the diagnostic
graph, as Excel values (Figure 232).
Figure 232
Diagnostic Graph Data - in Excel
1
...
...
220
221
222
223
224
...
...
344