
Technical Specifications

Masoneilan Valves ValVue ESD Instruction Manual =| 209
© 2014 General Electric Company. All rights reserved.
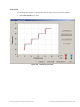
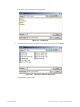
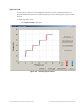
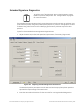
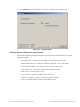
6. Click Continue to close the dialog and view the Diagnostic Graph (Figure 212).
Figure 211 Completing EXT
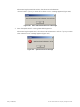
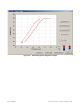
Extended Signature Diagnostics Graph Features
The Extended Signature Diagnostics Graph (Figure 212) has the same features as all other
diagnostic graphs:
Set Graph Scale - changes the coordinates of the Pressure Position axes.
Select Additional Curve - displays an additional, selected, curve on the graph.
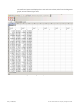
Show Computed Result - view the data in a numerical value format.
Show Data Points - shows data points collected during testing.
Save to File - save the graph to a file.
Export to Excel - exports the data as a CSV Excel file.
Capture to Clipboard - captures a bitmap image of the graph.
Close - closes the graph and returns the ESDVue screen.