Technical Specifications
Manuals
Brands
GE Manuals
Oilfield
GE Valve Software Tools MN-ValVue_ESD_IOM
201
202
203
204
205
206
207
208
209
210
© 2014 General Electric Comp
any. All rights reserved.
204
|
=
GE Oil & Gas
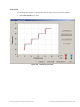
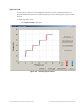
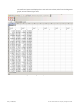
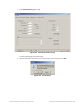
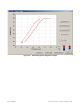
Microsoft Excel opens and displays the X axis
and Y axis values, taken from the diagnostic
graph, as Excel values (Figure 204).
Figure 204
Diagnostic Graph Data - in Excel
1
...
...
202
203
204
205
206
...
...
344