
Technical Specifications

Masoneilan Valves ValVue ESD Instruction Manual =| 191
© 2014 General Electric Company. All rights reserved.
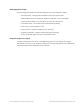
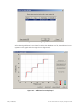
Step Diagnostics Graph
The Step Diagnostics Graph has the same features as all other diagnostic graphs:
Set Graph Scale - changes the coordinates of the Time Position axes.
Select Additional Curve - displays an additional, selected, curve on the graph.
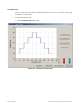
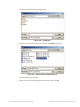
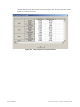
Show Computed Result - view the data in a numerical value format.
Show Data Points - shows data points collected during testing.
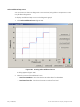
Save to File - save the graph to a file.
Export to Excel - exports the data as a CSV Excel file.
Capture to Clipboard - captures a bitmap image of the graph.
Close - closes the graph and returns the ESDVue screen.
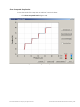
Diagnostic Graph Color Legend
Located at the bottom of each SVI II ESD diagnostic graph is a color legend. The legend
identifies by color each curve and step on the graph, currently displayed, and any additionally
selected (using the Select Additional Curves function).