
Technical Specifications

© 2014 General Electric Company. All rights reserved.
164 | =GE Oil & Gas
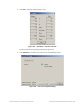
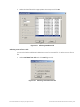
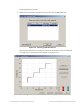
The Set Graph Scale window appears (Figure 147).
Figure 147 Set Graph Scale Window
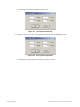
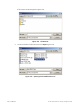
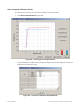
2. Adjust the X axis and Y axis coordinates as necessary and click OK (Figure 148).
Figure 148 Saving Scale Adjustments
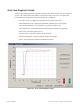
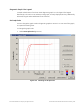
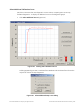
The Diagnostic Graph reflects the changes made to the axes.