
Technical Specifications

Masoneilan Valves ValVue ESD Instruction Manual =| 163
© 2014 General Electric Company. All rights reserved.
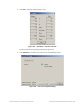
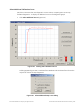
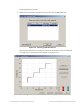
Diagnostic Graph Color Legend
Located at the bottom of each SVI II ESD diagnostic graph is a color legend. The legend
identifies by color each curve and step on the graph, currently displayed, and any additionally
selected (using the Select Additional Curves function).
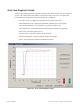
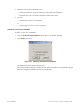
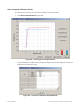
Set Graph Scale
You can change the graph scale on diagnostic graphs to narrow in on one area of the graph,
or expand the viewing area.
To change the graph scale:
1. Select Set Graph Scale (Figure 146).
Figure 146 Selecting Set Graph Scale