
Technical Specifications

© 2014 General Electric Company. All rights reserved.
162 | =GE Oil & Gas
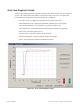
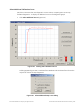
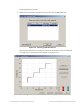
Auto Tune Diagnostic Graph
The Auto Tune Diagnostic Graph (Figure 145) displays the results of Auto Tune in a graphical
format. The X axis shows Time and the Y axis shows Position over Time. The graph has
several features that provide even further diagnostic capabilities.
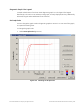
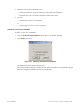
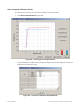
Set Graph Scale - changes the coordinates of the Time Position axes
Select Additional Curve - displays an additional, selected, curve on the graph
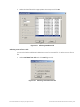
Show Computed Result - view the data in a numerical value format
Show Data Points - when selected shows data points collected during testing
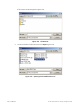
Save to File - saves the graph to a file
Export to Excel - exports the data as a CSV Excel file
Capture to Clipboard - captures a bitmap image of the graph
Close - closes the graph and returns the ESDVue screen
Figure 145 Auto Tune Diagnostic Graph