
Technical Specifications

© 2014 General Electric Company. All rights reserved.
160 | =GE Oil & Gas
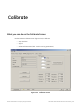
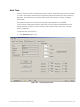
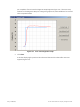
On completion of Auto Tune the Diagnostic Graph appears Figure 142. There are many
features on the Diagnostic Graph to change the graph scale, select additional curves and
show computed results.
Figure 142 Auto Tune Diagnostic Graph
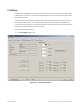
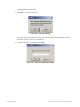
4. Click Close.
A window displaying the previous PID values and the new PID values after auto tune
appears (Figure 143).