
Technical Specifications

Masoneilan Valves ValVue ESD Instruction Manual =| 145
© 2014 General Electric Company. All rights reserved.
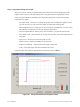
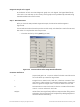
Diagnostic Graph Color Legend
At the bottom of each SVI II ESD diagnostic graph is a color legend. The legend identifies by
color each curve and step on the currently active graph and any additionally selected (using
the Select Additional Curves function).
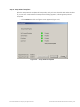
Step 7 - New Parameters
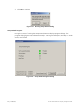
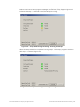
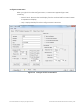
After you close the Setup Wizard Diagnostic Graph, the PID Values window appears
(Figure 126).
The PID Values window shows the previous and the newly calculated (as a result of auto tune)
PID values. To complete the auto tune process:
Close the window by clicking Exit (Figure 126).
Figure 126 New PID Values After Setup Wizard Calibration
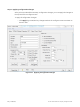
Parameter Definitions
P Proportional gain in %. Common values for the PST controller are 50
for small valves up to 4000 for large valves.
I Integral time or reset time in 1/10th sec, is the time constant of inte-
gral control. Higher values of I cause less integral action, however a
value of 0 gives no integral action. Common values are 10 to 200.
D Derivative time or rate time (msec) is the time constant of derivative
control. Common values are 10 to 100.
Padjust Valves often have significantly different response when filling verses
exhausting. The proportional gain is adjusted by adding Padj (%) to P
when the valve is exhausting.