
Technical Specifications


625
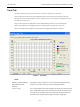
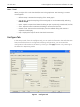
Trend Tab
Position Indicator This indicator shows the valve position graphically. The indicator
consists of three parts:
The upper part contains an indicator that shows the value
of the signal. In Operating mode this is the position setpoint.
In manual mode, this is the position that the valve moves to
if operating mode is selected.
The center green bar shows the valve position with full left
as closed and full right as open. The numerical valve
position is shown in the center.
The lower part contains an indicator (thumb) that shows the
valve setpoint. In operating mode this is the same as the
signal. In manual mode it is the valve setpoint. Drag the
thumb to change the valve setpoint. While dragging, the
number in the center bar shows the manual setpoint
selected when you release the thumb.
You can also change the manual setpoint by right-clicking in the
indicator. A dialog box appears where to type the exact setpoint for
use.
Change
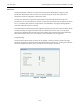
Mode When selected, you can change the SVI2 mode.The SVI2 can be in
any of three operating modes:
Operating- In this mode the SVI2 responds to the input
signal and positions the valve appropriately (indicator
green).
Manual- In this mode the valve does not respond to the
input signal Instead it remains stable in one position which
is the position that the valve was when manual mode was
entered or a new position is selected (see Setpoint)
(indicator yellow).
Setup- In this mode you can set calibration and
configuration parameters. Additionally you can run
response time tests, step response tests, and positioner
signatures. (indicator yellow).
Capture to Clipboard Clicking this button saves an image of the graph on the clipboard.
The image (a bitmap) may be pasted into another document (e.g.
into a Microsoft Word document).
Zooming
Any portion of a diagnostic graph may be examined more closely by entering the new X and
Y scales in the proper scale edit boxes or by dragging the mouse across an area of the
graph. If the mouse is dragged across an area, that area fills the graphic window. Right
button clicking on the graph restores the default scales.