
Technical Specifications


ValVue Digital Communications Software Ver. 2.80
624
GE Oil & Gas
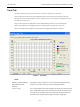
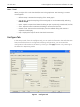
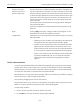
Trend Tab
Use the
Trend
tab to see the performance of the valve in real time as it operates.
These graphs are useful for tuning the PID parameters and monitoring valve performance by
showing valve position and setpoint as they change over time. The process trend graphs may be
zoomed only on the Y axis.
The process trend can be detached from the tabbed dialog so that it can be viewed while
performing calibration and diagnostic tasks. To detach the trend, right-click in any tab.
When in manual mode, change the valve position by dragging the position indicator.
Figure 4 Trend Tab
Fields
Position, Manual Setpoint,
Signal Setpoint and
Pressure
The display of any of the four curves on the Trend graph may be
turned on or off by checking or unchecking these boxes.
Y Low/ Y High The Y axis (position) of the trend graph can be set by entering the val-
ues in these edit boxes. Enter a number and hit tab to set the scale.
The axis can be changed with the mouse by zooming and can be
returned to the original scale by right-clicking in the graph.