
Technical Specifications

535
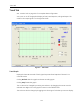
Trend Tab
Trend Tab
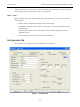
See “Monitor Tab” on page 527 for nameplate data configuration.
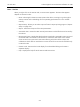
You to turn on or off the graphical display of Level, Level Setpoint, and signal Output. The
scale for the output signal is on the right hand side.
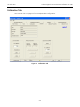
Figure 2 Trend Tab
Trend Graph
Displays the last 180 seconds of level, signal output and level setpoint if the HDLT is in
controller mode.
Clicking Refresh clears the graph and starts recording again.
Clicking Stop freezes the graph.
The Y scale can be changed by entering new values or by dragging the mouse over the
selected area. Right-click in the graph to return it to the default scale.
The scale can also be change by dragging over the range of scale that you want to display.