
Technical Specifications

ValVue Digital Communications Software Ver. 2.80
226
GE Oil & Gas
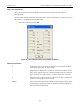
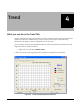
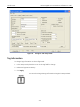
Trend Graph Features
The display of any of the four curves on the Trend graph may be turned on or off by checking
or unchecking these boxes:
Position: blue
Manual Setpoint: black
Signal Setpoint: red
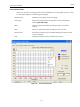
Trend: Y Low/High The Y axis (position) of the trend graph can be set by entering the val-
ues in these edit boxes. Enter a number and hit Tab or Enter key to
set the scale.
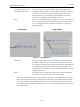
Position Indicates the actual valve position in % of valve opening. 0% is
always closed and 100% is open. Because the travel of a valve may
exceed its nominal travel, positions greater than 100% are possible.
Changing the Graph View
Any portion of a diagnostic graph may be examined more closely by entering the new Y scale
in the proper scale edit box or by dragging a box across an area of the graph. If the mouse is
dragged across an area, that area fills the graphic window. Right clicking or double clicking on
the graph restores the default scales. The X scale cannot be resized.
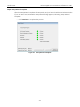
Capture to Clipboard
Clicking this button saves an image of the graph on the clipboard. The image (a bitmap) may
be pasted into another document (e.g. into a Microsoft Word document).