
Technical Specifications


ValVue Digital Communications Software Ver. 2.80
142
GE Oil & Gas
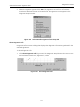
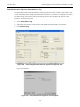
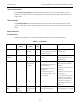
The Diagnostic Information dialog appears displaying the data for the curves in the
Diagnostic Graph (Figure 121).
Figure 121 Diagnostic Information
2. Click OK to close the dialog.
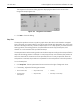
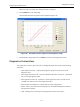
Step Test
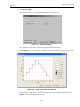
The Step Test produces a time vs. position graph where the valve is submitted to a stepped
input. The graph can contain data for 2 to 60 seconds of data with data taken up to every 0.05
seconds. The step profile may contain multiple steps. To run a step profile, you must enter the
starting position, the ending position, the pause between each step, the step size, and
whether or not to measure both up and down steps.
The step test starts at the starting position and makes steps according to the size specified in
step until the ending position is reached. For each step, the SVI II AP measures the position at
even time intervals for the amount of time specified in time. If 2-way is specified, when the
end position is reached, the procedure is repeated from the end position to the start position.
To run the Step Test:
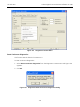
1. Click Step Test. The test parameters become active to the right of Diagnostic Tests.
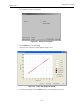
2. If necessary, adjust the following parameters:
Start Position (%) Stop Position (%) Time (s)
Sample Rate
(samples/s)
Step Size (%) One Way or Two Way