
Technical Specifications


139
Standard Actuator Signature (Std.
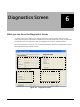
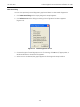
Diagnostics Screen
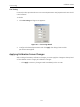
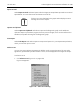
5. Click Continue and Figure 117 appears.
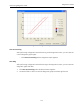
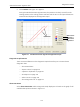
During the Standard Actuator Signature test, the positioner is slowly moved from the
starting position to the ending position and back and the two curves (up and down) are
measured and displayed in the Diagnostic Graph.
Figure 117 Standard Actuator Signature Diagnostics Graph
Diagnostic Graph Features
There are several features on the Diagnostic Graphs that allow you to view and save
diagnostic data:
“Show Data Points”
“Export to Excel” on page 140
“Capture to Clipboard” on page 140
“Print Report” on page 140
“Select Curves” on page 140
“Show Diagnostic Info” on page 141
Show Data Points
Select Show Data Points and the Diagnostic Graph displays a tick mark on the graph for all
available data points as shown in Figure 117.
Select Curve
Data Points
Select curve
Signature 1
Signature 2