
Technical Specifications

117
4
Trend Screen
What you can do on the Trend Screen
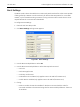
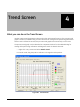
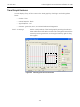
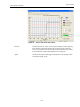
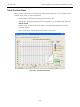
Use the Trend screen (Figure 89) to observe the valve real time performance. The process trend
graph is useful for troubleshooting a control valve and for tuning the PID positioning parameters.
As the X axis is defined in seconds, the process trend graphs are zoomed only on the Y axis.
The process trend graph can be detached as a separate window from the tabbed dialog for
viewing while performing calibration and diagnostic tasks. To detach the trend:
Right-click in any screen and select Detach Trend.
In manual mode, drag the position indicator to change the valve position.
Figure 89 Trend Screen