
User Manual Part 7

8-16 ApexPro™ 2001989-301A- draft 1
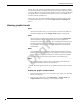
Viewing stored patient data
Printing vital signs data
NOTE
Up to five events of the Vital Signs data for telemetry patients can be printed to a
digital writer.
Complete the following procedure to print periodic and episodic trend data in a
tabular format to a laser printer:
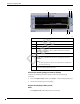
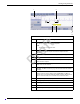
1. From the single patient viewer, click Patient Data... > Vital Signs. The Vital
Signs window displays.
2. Click the down arrow next to the Vital Signs sort tool and choose the data group
you want to display. The data sorts itself by your chosen category.
3. Click the Interval button to choose the time interval of the displayed data.
4. Click (print button) located in the top right corner of the Vital Signs
window.
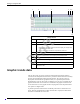
Measuring ECG waveform intervals and amplitude
NOTE
This section provides a brief overview of the calipers function. For more
information, refer to the CIC Pro Clinical Information Center Operator’s Manual.
When full disclosure data is collected and stored at the CIC Pro center, you can use
the Calipers measurement tool to measure the PR, QRS, QT, and R-R waveform
intervals and the ST waveform amplitude.
Viewing or printing a waveform from the Calipers window
Complete the following procedure to print or view a waveform from the Calipers
window:
1. From the multi-patient viewer, click on the patient you want to view. The single
patient viewer displays.
2. From the single patient viewer, click Patient Data... Then, choose the data
review tool you want to use to locate a waveform segment or waveform strip you
want to measure.
NOTE
When an event or ECG data sample occurs outside of the time limit of your
full disclosure license, the data will not be available to view from the
Calipers measurement tool.
3. Click Calipers to display the Calipers window. Ten seconds of waveform data
displays.
Draft